Open Data Camp - 22/23.03.2013
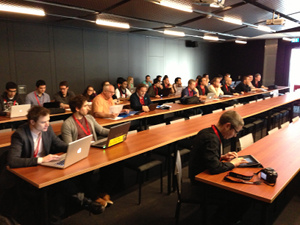
The Swiss Make.Opendata.ch Hackdays in Berne and Sierre brought thinkers and makers together around the topic of financial open data. Please support these projects to help accelerate openness, innovation and efficiency in private and public budgeting!
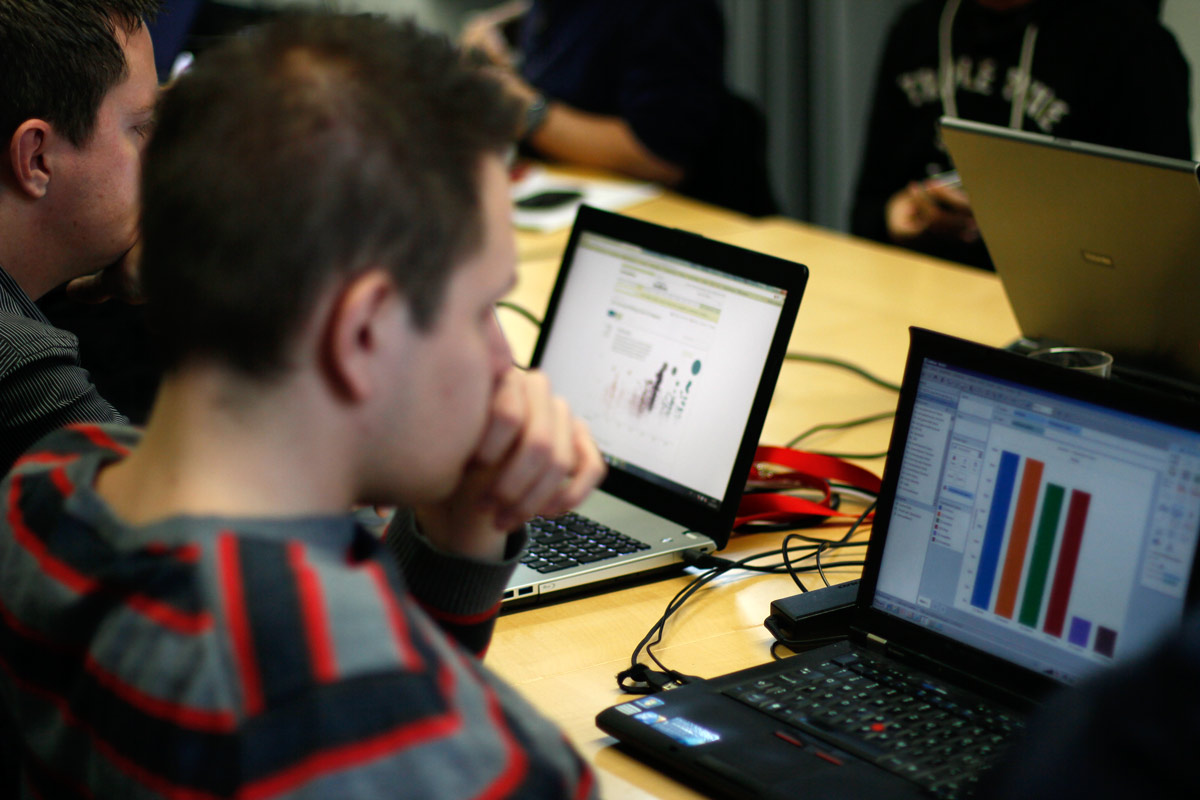

Photos left & middle CC by Jan Rothenberger
:: Projects from Sierre :: Projects from Berne :: Blogs and press coverage ::
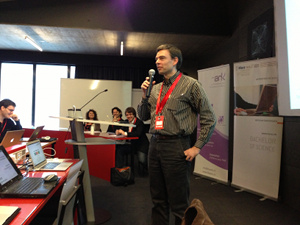
Panel discussion
Video: Podiumsgespräch über Möglichkeiten und Grenzen der Visualisierung von Finanzdaten (Opendata.ch Mitgliederversammlung, 21.03.2013)
Video: Videobotschaft an die Open Data Community von Jacqueline Badran, Nationalrätin (make.opendata.ch Hackdays, 22.03.2013)
Berne
Tax Freedom Day: Recently, various media published results of the ESTV (Eidgenössische Steuerverwaltung) which show the so-called “Tax Freedom Day”, the day of the year when a citizen has earned enough money to compensate for the taxes he/she paid. The idea of this project is thus to craft an interactive, thematic map/visualization of this data. It should allow the viewer a quick, informative and salient overview of the spatial disparities in the Swiss tax system. See: demo - source - doku
Qualified Money: This project simulates the spreading of tainted money. In a second step, it implements qualifiers that regulate different qualities of money. First step was to gather money flow data. For this purpose, every country's trade import and export is used. Money can be contagious (i.e. if a country receives _any_ bad money, the country is 'bad') or bad money dilutes with respect to the money reservoir of the country. Starting from an initial setup (all countries good, one bad; half good; half bad; …), year by year the quality indicater is updated according to the flows of money. See: source - doku
Open Aid: The idea of this project is to visualize financial flows data on Swiss foreign aid. In a study about transparency of foreign aid by an NGO last year, the Swiss Agency for Development and Cooperation SDC only received 25 out of 100 points. How much money goes to foreign aid from the public and the private sector, where does the money come from and where does it go? And how much of your tax money is used on foreign aid? Let's make this data transparent, by using great visualizations! See: demo - source - doku
Open Budget: Building upon a successful project initiated in April 2012 at the 1st Berne Open Data Hackday to create an interactive visualization of the budget of the city of Berne, the project team at the finance hackdays concentrated on visualizing the budget of the city of Zurich as well as of all (!) municipalities of the canton of Bern. Dive into and through your city's budget and get a sense of where your money goes, and where your city gets it from. See: demo (City of Zurich, 2013) - source - doku
Finanzausgleich Kanton Bern: Dieses Projekt visualisiert die Geldflüsse des kantonalberner Finanzausgleichs und stellt so einer breiten Öffentlichkeit übersichtliche Grundlagen für die Diskussionen über das Thema “intrakantonale Solidarität” zur Verfügung. Siehe: demo - source - doku
FTTH Business Model Navigator: The objective of this project is to visualize the current FTTH deployment status, and to create a easy-to-use service for municipalities and the public to make a business plan for facilitating the decision if setting up FTTH pays out or not. See: doku
Cumulizer: This project has got a focus on analyzing personal shopping data. We have started by aggregating data available from the Cumulus purchase points program run by Migros, but would be interested in expanding the concept to Coop Superpunkt and others. See: demo - source - doku
Mobile Deck Card Game with Financial Data: The outcome of this project is a card game, where you compare a community's financial data with anothers, the one with the higher value wins, if you loose, you loose a card, if you win, you get one. See: demo - source - doku
Semantic Legal: Swiss laws and regulations are mostly accessible online, though some by subscription only. The goal of this project is to think about new ways of how Swiss laws and regulations could be published using powerful semantic tools to create Linked Open Data. See: doku
Bern presentations
- Thomas Preusse, local.ch: Open Budget App Bern (Presentation)
- Christoph Schaller, Berner Fachhochschule: Finanzstatistik Gemeinden Kt. Bern (Präsentation)
- Daniel Studer, Amt für Gemeinden und Raumordnung Kanton Bern, und Beat Dänzer, Finanzverwaltung Kanton Bern: Finanzausgleichsdaten des Kantons Bern (Präsentation)
- Claudia Bretscher, Statistik Stadt Zürich: Finanzdaten der Stadt Zürich (Präsentation)
- Urs Derendinger: Steuerdaten des Kanton Schwyz - Einkommen und Vermögen von 2001 bis 2009 (Präsentation)
- Roland Studer, Puzzle: Gemeinde-Quartett (Präsentation)
- Timo Grossenbacher: Vis 4 Tax Freedom Day (Präsentation)
- Andreas Kellerhals, Direktor Schweizerisches Bundesarchiv: Digitalisierte Staatsrechnungen und Budgets des Bundes 1849 bis 1998 (Präsentation als PPS und PDF)
- Niklaus Hug und Martin Blumenthal, NTS: FTTH Business Model Navigator
- Prof. Dr. Dirk Helbing, ETH Zürich: FuturICT Financial + Innovation Platform (Präsentation)
- Adrienne Fichter und Stefan Zollinger, Orell Füssli Wirtschaftsinformationen OFWI: Öffentliche vernetzte Handelsregisterdaten Infocube.ch (Präsentation)
- Thomas Bisig, Olsen: The Bubbles of Market Dynamics - A Dynamic Tool to Assess Market Dynamics (Präsentation)
- Barbara Kummler, Hochschule Luzern: Verständlichkeit (Präsentation)
- Sebastian Loosli: Demokratie und Entscheidungen (Präsentation)
- Christian Studer: M-Connect Migros Cumulus
- Danilo: OpenAid http://make.opendata.ch/wiki/project:openaid
- Oleg: Statistical Linked Datasets and http://Tambur.io
- Julius Chorbak: http://Mingle.io
Sierre
Link the Swiss Open Tourism Data to the World Linked Open Data ( video - DEMO ): Open data (and data in general) are often isolated silos. Linked open data aims to connect these solitary informations to the other data sources in the web. If each data are linked, we can jump from link to link to retrieve and discover new knowledge. The idea here is to convert available tourism statistical data (e.g. nights, occupancy, by canton) to linked open data format (RDF), and link those data to make them part of the LOD cloud. This project will thus fulfill the maximum data quality according to Open Data 5 stars. To create an added value, different information from various data sources must be linked together. Many data sources implement the RDF format to describe their meta data. That's why we're going to use as much RDF data sources as possible. Those statistical data will thus be linked to other Linked Open Data sets (as DBPedia, geoNames), and the information from the different sources can thus be queried at will.
Partis Budgets ( video - DEMO ): By Year and Canton, public expenses and parties representation in local parliament.
Crowd Interest: It is difficult to get an aggregated source of data that describes the number of tourists having visited different places in Wallis. The idea is to infer this information by using flickr: by using either the geotagging of the uploaded photos or the taggs it is possible to get an idea of how much persons have visited a certain place.
Partons en piste ! (DEMO): This project aims to develop an app that help by selecting certain criteria (meteo, quality of the snow, traveling duration, …) the best place to make ski.
Holiday Apartments: this project should give the users the opportunity to search for holiday apartments. The users can enter a city on a map and all free apartments are shown with the relevant information.
Mon pouvoir d'achat: On vous offre un nouveau travail à Genève avec une augmentation de 1000.- CHF à la clé. Est-ce réellement intéressant, combien allez-vous objectivement gagner en plus par rapport à votre situation actuelle? Le coût de la vie n’est pas le même partout en Suisse. Il peut être trompeur de croire qu’une augmentation signifie une réelle augmentation de votre pouvoir d’achat. Les calculs pouvant être rapidement compliqué, entre impôts, coût du logement ou simplement l’essence, une solution plus simple et rapide doit être apportée. Ce service doit permettre, à la base, de répondre à cette question en vous disant combien d’argent il vous restera après avoir tout payé si vous acceptez l’offre, avec, en plus, un détail des dépenses dans le nouveau canton. Pour ce faire, il suffit de rentrer le canton de départ, le canton d’arrivée, votre revenu actuel, le revenu futur espéré et lancer l’application. L’opération est vite effectuée, mais le renseignement très utile.
Electronomy Ma commune peut elle vivre en autonomie électrique ? Ce projet vise à déterminer le potentiel de production solaire photovoltaique mise en rapport avec la consommation électrique d'une commune ou d'un canton.
Sierre Presentations
- 3 Façons d’accèder aux services proposé par les Administrations ch.ch / services web (SECO) / web sémantique (Ecole d’Ingénieurs Fribourg) – Florian Stoller (Softcom/eGovTech)
- Geo.admin.ch et son API – Loic Gasser (Office fédéral de topographie swisstopo) (15 min)
Press
Blogs and press coverage:
- Make finance: Fotoreportage vom Hackday (Jan Rothenburger, runthenumbers.org, 27.03.2013)
- «Prinzipiell geht es um Gerechtigkeit» (Journal B, 25.03.2013)
- Wie visualisiert man das Budget der Stadt Zürich? (Netzwoche, 25.03.2013)
- Hackday zu Finanzdaten erfolgreich durchgeführt (digitale-nachhaltigkeit.ch, 25.03.2013)
- Software zeigt, ob sich Glasfaser auch lohnt (Blick am Abend, 22.03.2013)
- Les Antifacebook se réunissent à Berne et Sierre (24 heures, 21.03.2013)
- Politische Komplexitat vs. Datenjournalismus (Christian Studer, 21.03.2013)
- Open finance data hackdays in March 2013 (Oleg Lavrovsky, 18.03.2013)