This is an old revision of the document!
Tangible Statistics
We did some explorations on how to use a MakerBot DIY 3D Printer to make open data easier to grasp. An introduction can be found here:
http://www.tamberg.org/makeopendata/2012/Tangible_Statistics_with_MakerBot.pdf
Note the constraints imposed by using a MakerBot compared to using a commercial 3D printer.
A data set and visualization from the Ville Vivante project (http://villevivante.ch/) kindly donated by @wiederkehr was used to explore different 3D interpretations.
Wearable data in the form of earrings is an obvious choice, as they're quick to print (7 min in our case) and quite effective despite the cheap material (ABS plastic).

Here's another object made from the same data, the “Commuter Statistics Egg Cup” together with an EggBot painted egg.

While printing out 3D graphs would be perfectly possible, it seems more interesting to take 2D data and use the third dimension in a more creative way. In one design we rotated 2D CSV values of yearly birth numbers (http://od.ifi.uzh.ch/package/geburten-jahr-quartier) around an axis
![]()
to create objects looking like chess figures. Imagine playing “birth statistics chess” or “car accident chess” with individual figures derived from the statistics of different cantons.
![]()
Mashing up data and everyday objects results in a loss of information, but introduces an opportunity to think about the corresponding events, encoded in the data, while using such an object.
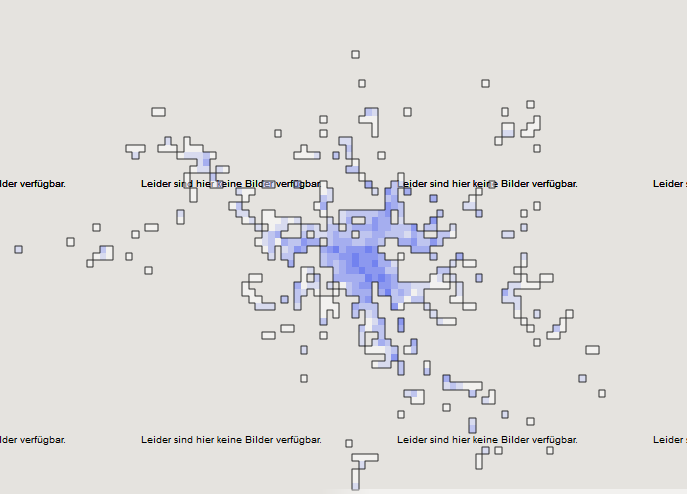
Another visualization approach is using a heat-map to generate a 3D relief. The example below uses data from http://transport.opendata.ch/